
[SARK-100 Pc Scan] SWR Analyzer Software
Watch my other projects: https://sm6why.n.nu/
Note:
Owen (VK1OD) has written a blog about this program. http://owenduffy.net/blog/?p=10536 The software is now updated. ( Since Ver. Nov-2017 ).
What I have done is to make this analyzer a little more convenient from my perspective. I made my own calculations to solve the negative reactance which the SARK-100 or its clone cannot. ZPLOT is used to show the Smith chart. And now the new version of SARK-100 Pc Scan has the possibility to set the algorithm to try to solve the sign of X.
There is three possible ways to display the Smith chart. Using “None” will display the values as they are calculated without any algorithm. Using SARK’s internal calculations will display only positive values.
AC6LA Dan Maguire, explains how the algorithms work in ZPLOT.
The "Phase" option looks for places where the Phase angle approaches 0 or 180 degrees and then does further processing to determine the correct sign for X. This option works in most cases and is the one you should try first.
The "Rotation" option works on the principal that the Smith chart trace should always rotate in a clockwise direction as the frequency increases. This option works even if the Phase angle does not approach 0 or 180 degrees but does not handle cases where the Smith trace has "closed loops" that are not centred on the middle of the chart.
---------------------------------------------------------------------------------------------------------
The SARK-100 is a SWR analyzer and the range is from 160M to 6M. The Mini-60 and MR-100 also works with this software.
One nice feature is the PC interface which makes it possible to do some automation.
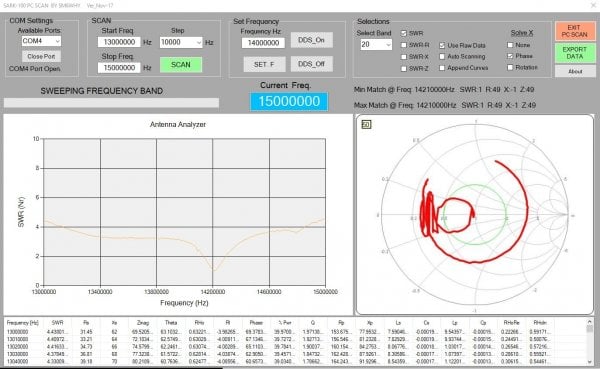
I have made a program that scans the SARK-100 and plot the SWR Vs frequency. The data can also be stored as an Excel file. The min and max match frequency is calculated.
Remember that you also need the USB driver and the .NET Framework installed. There is no installation file in this version just unzip the file and then start the program with the exe file.
I have heard from users that they got errors after scan is done. This is because they do not have EXCEL installed.
The program is developed with a screen resolution of 1920X1200. Some older PC's/Laptop's can't handle that. The frame will not fit the screen and that can of course be annoying. First set the "Make text and other items larger or smaller" to smaller. And make sure you use the highest resolution and correct driver for your graphic card and display. Current version can be re-sized.
Drivers
http://www.ftdichip.com/Drivers/VCP.htm
http://www.microsoft.com/en-us/download/details.aspx?id=42643
The Chinese clones sometimes change the serial chip. If you cant get contact between the Pc and Sark-100/Mini-60 you can try these drivers.
New update! Aug-2018
News in Aug-2018 is more a face lift and exported X graph displays negative values.
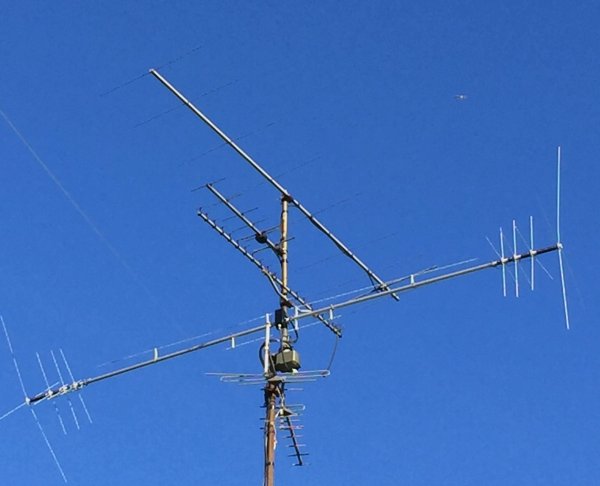
Here is my AmPro-80 antenna mounted on my roof (tested form the schack). I do not have space for a big 80m antenna.
Old version.
Note. If you do not want to change how the solve X is displayed from previous scans you don't need to do anything. It is not possible to toggle between different X and up-date the Smith-chart without doing a re-scan.
If the "use Raw data" is selected the SARK-100 software do the calculations from the raw values from the reflectometer. The SARK-100 internal calculations is used when the "use Raw data" is un-checked.
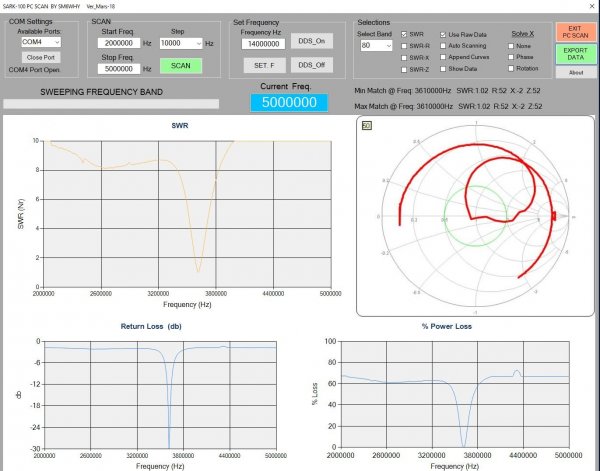
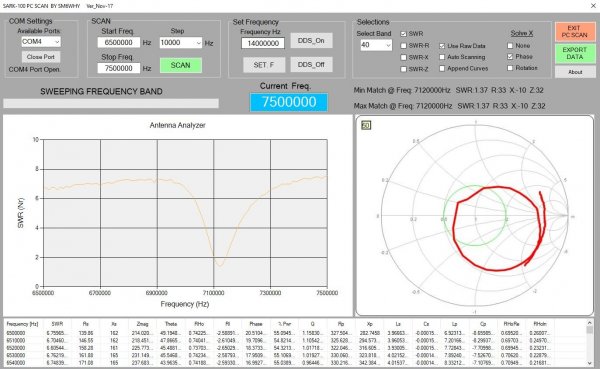
Here is the Raw data used and all calculations is made in the SARK-100 Pc-Scan software. The Phase selecion is used. Just a piece of wire is connected to the SARK-100. (Nov-17 version)
When export data is used the data is saved in an Excel file.
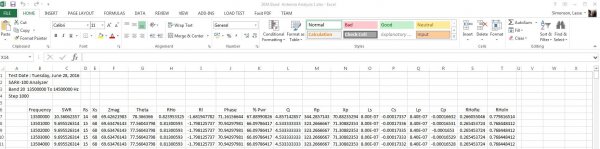
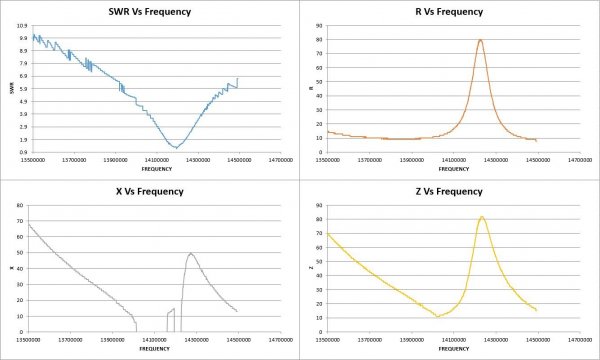
Some plots are also made.
If you have bookmark this page do a reload of the page occasionally to be sure it is the latest version.
If you like the program and feel to donate use the Donate button.
>Hints:
- Microsoft EXCEL needs be installed. The reason is that the data are saved as an EXCEL file. And also for the ZPLOT.
- There has been reports saying that EXCEL Ver.2010 doesnt work. I have not tried all versions.
- All Windows versions from Win-7 should work.
- If you dont see any SWR graph after the scan you probably needs to set a dot instead of comma in the regional settings in your PC. You will find it in the control panel.
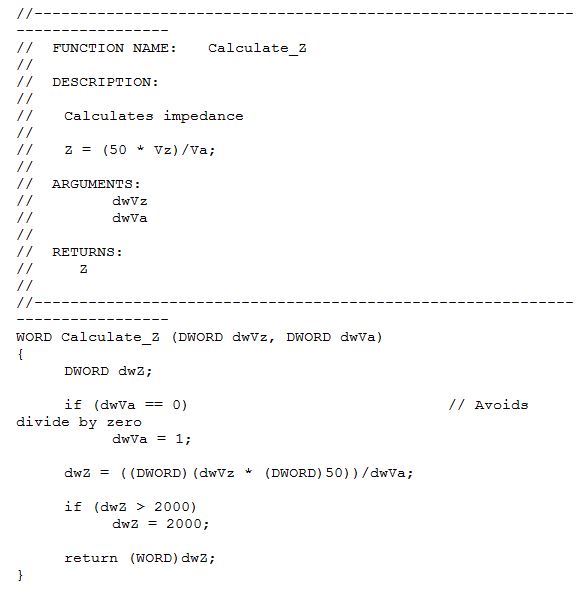
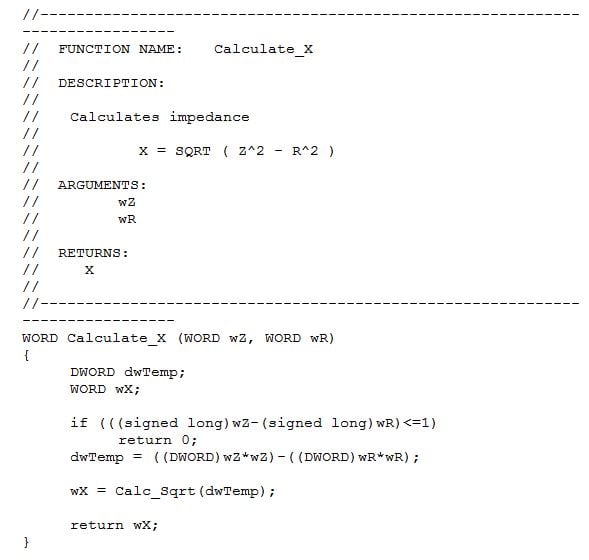
- The Smith chart do not show negative values and the reason is the calulations done inside the SARK-100. The calculations for X and Z can be seen below. To prevent divide by zero Z is set to 1. A modification in the SARK needs to be done to prevent this. Available from Nov-2016 using Raw values.
Below is the internal calculations for Z and X.
There is no manual for this program, however I think it is quite simple to understand.
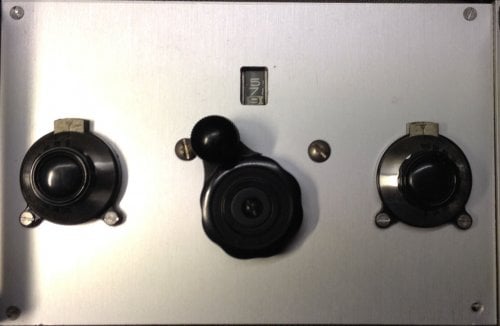
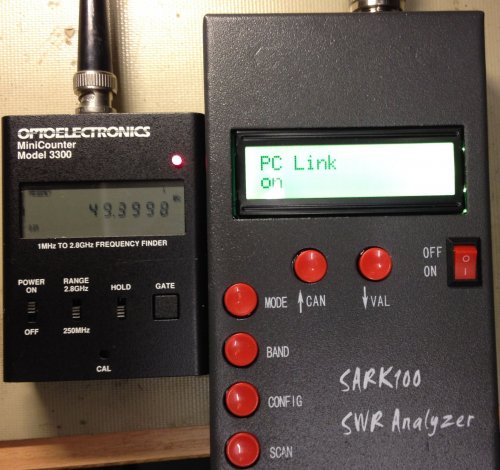
1. Set the SARK-100 for Pc communication. Press the Config button once and then the Val button once.
2. Open the com port in the SARK-100 Pc Scan.
3. Select the band you want to scan. (Or manually enter the desired range)
4. Select how the sign of X should be solved.
5. Press the SCAN button. If the Auto Scan is checked a new scan will automatically start.
6. Now you can toggle the graph to see different data.
7. When SCAN done you can export the data with the EXPORT button. You need to have Excel installed.
8. Remember that it will take a while to handle the information if the frequency span is large and the step are small.
9. The files are saved in: c: Test-Reports SARK-100
It is now possible to give feedback in the Blog page. https://sm6why.n.nu/blogg
My HF and 6M antenna is a MFJ-1775 rotable dipole.
This is a great device that can be used for many different tasks. One thing I tested is my home made antenna tuner which works for 20 and 40M for my "half G5RV" antenna.
My homebrew tuner which can match 20 & 40M band with my half G5Rv antenna.
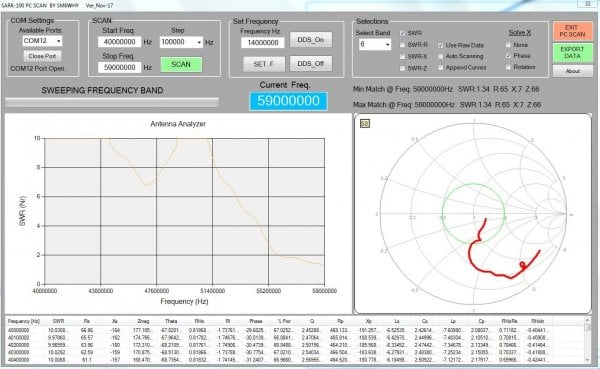
Frequency test of the SARK-100 (Chinese model)
Let's see if the analyzer keep it's manufacturer's promise?
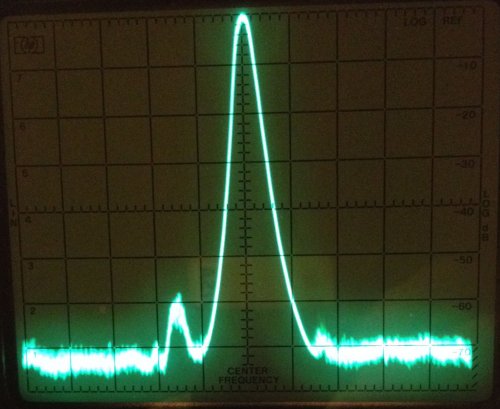
Spectral Purity: Harmonics down >- TBD dB beyond 60 MHz
Here is a 50MHz signal generated from the SARK-100.
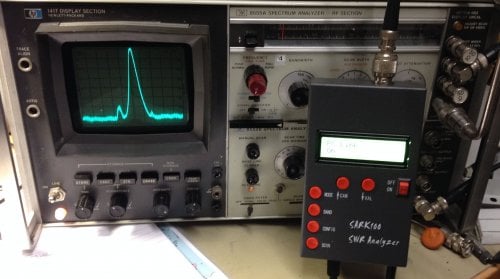
And the spectral purity looks to be ok, -60db.
A simple frequency test was also performed.
If you would like to see more projects please goto: https://sm6why.n.nu/
Welcome
Welcome to sm6why.n.nu.

My Newsletter
Links